Our highway network
Derbyshire County Council has a duty under The Highways Act 1980 to maintain all adopted highway assets in the county (except within Derby City).
In accordance with the current national guidance we have broken down our network into resilient and non-resilient networks including creating our own road hierarchy.
The resilient network
These are roads we give priority to protecting in adverse conditions – this is around 300 miles of our entire road network. Usually this is during extreme weather – snow, ice and flooding – but it may also include events like industrial action and major incidents.
The non-resilient network
These are the remaining roads and are categorised in order of importance, helping us to prioritise how we look after them. This is called the network hierarchy which ranks carriageways from 1 to 7 where 1 is highest priority.
We maintain our network using a blend of in-house and external design and construction service provision to deliver over £40million of work per annum.
The total value of the highway asset in Derbyshire is over £8 billion.
Breakdown of our network
Lengths of highways, footways, and cycleways (km)
| A roads | B and C roads | U roads | Total roads | Footways | Other Public Rights of Way | Cycleways and greenways |
|---|
| 684 km |
1,777 km |
2,885 km |
5,346 km |
5,113 km |
5,224 km |
276 km |
These figures are the county’s most visible asset groups, however we also maintain many other assets such as road markings and signs, street lighting columns, traffic signals and pedestrian crossings, other street furniture, verges, highway drainage, bridges, landslips and retaining walls, safety fences and other assets, including:
Carriageways
- 3,361 miles of carriageways
- over 2,796 miles of footways
- 2 escape lines
Structures and assets
- 221 landslips
- 81 rockfaces
- 4 gantries
- 814 miles of highway retaining walls (walls that support the highway network)
- 1,234 highway bridges
Street furniture
- 2,407 pedestrian barrier locations
- 76,984 traffic signs
- 2,000 non illuminated bollards
- 69 miles of vehicle restraint systems
- 803 county council grit bins
- 13 county council bus shelters
- 6,122 county council bus stop poles
Street lighting
- 90,200 street lighting columns
Electronic traffic management
- 133 signalised junctions
- 26 toucan crossings
- 13 pelican crossings
- 263 puffin crossings
- 7 pegasus crossings
- 166 permanent electronic warning signs
- 67 mobile electronic warning signs
- 300 flashing amber warning lights
- 238 zebra crossings
- 246 real time passenger information screens
- 108 fixed road safety camera housing units
- 42 car parking meters
- 250 traffic counting devices
- 7 weather stations
- 8 car parking guidance signs
- 96 CCTV cameras
- 11 over height warnings
- 9 Variable message signs
Drainage
- 574 culverts
- 160,944 gullies
Public rights of way
- 2,788 miles of public rights of way footpaths
- 380 miles of bridleways
- 43 miles of restrained byways
- 36 miles of byways open to all traffic
- 348 public rights of way footbridges
- 660 minor public rights of way footbridges
- 276 miles of cycleways and greenways
Further information on our network can be found in our guide to highways document attached to this page.
Highways maintenance spending figures
Highway maintenance spending in Derbyshire from 2020/21 to 2025/26
| Year | Capital allocated by DfT (£,000s) | Capital spend (£,000s) | revenue spend (£,000s) | Estimated % on preventative maintenance | Estimated % on reactive maintenance |
|---|
| 2025/26 (projected) |
£41,174 |
£40,000 |
£19,938 |
67% |
33% |
|---|
| 2024/25 |
£30,385 |
£28,148 |
£18,937 |
60% |
40% |
|---|
| 2023/24 |
£34,236 |
£31,629 |
£21,123 |
60% |
40% |
|---|
| 2022/23 |
£27,371 |
£32,501 |
£20,522 |
61% |
39% |
|---|
| 2021/22 |
£27,371 |
£37,816 |
£15,138 |
71% |
29% |
|---|
| 2020/21 |
£35,004 |
£27,192 |
£17,372 |
58% |
42% |
|---|
Additional information on spending
The county council uses 2 types of funding for highway work: revenue and capital funding.
Revenue is mainly used for reactive safety repairs (such as pothole filling) and cyclic works (such as gully emptying, grass cutting, condition surveys and winter maintenance), as well as for energy.
Depending on the number of potholes in a year we usually spend between £2 million and £3 million filling them.
Capital funding typically pays for new and replacement infrastructure such as:
- planned carriageway patching
- carriageway resurfacing
- carriageway preventive treatments
- footway resurfacing
- footway preventative treatments
- drainage schemes
- bridges and structures
- landslips
- traffic signs and road markings
- traffic lights and pedestrian crossings
- street lighting
- greenways
- public rights of way works
- cycleways
The poor condition of local roads has been a concern nationally for many years, with a figure of £16.81 billion quoted as a one-time catch-up figure nationally (Alarm Survey 2025) which would take 12 years to achieve.
The overall decline in local road condition has not been helped by an under investment in preventative treatments and the impacts of extreme weather events.
The lack of preventative maintenance means that roads become less able to cope with extremes of temperature and severe weather, due to a loss of flexibility in the asphalt as it ages, causing it to pothole and fail.
Preventative treatments should be carried out when little or no pre-patching is required, this is often seen by the public as wasting money when there are roads in a worse condition elsewhere. Consequently, as overall budgets have reduced more funds have been directed at structural works such as resurfacing.
Preventative treatments represent substantial value for money and if carried out at the right time will extend the life of the road for many years at a fraction of the cost of resurfacing.
This is shown in the risk and cost diagram, which demonstrates a 7:1 cost benefit for a timely preventative treatment against a structural treatment:
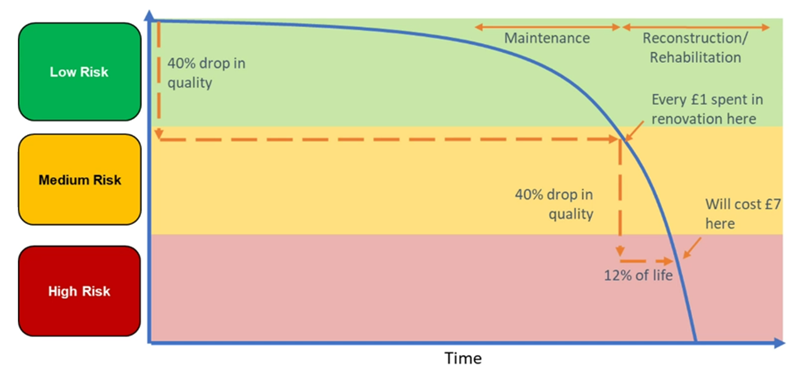
When a road has deteriorated beyond a surface treatment then a structural treatment is required to replace one or more of the asphalt layers to bring the road back up to standard.
In 2025/26 we will be structurally resurfacing approximately 8 km of road and laying in the region of 93 km of preventative maintenance treatments, these will prolong the life of the road and prevent potholes.
Estimate number of potholes filled
| 2020/21 | 2021/22 | 2022/23 | 2023/24 |
|---|
| 92,775 |
102,225 |
85,726 |
80,254 |
Further analysis indicates inaccuracies in the table, therefore, we cannot confirm its reliability. Our highways department is implementing a new asset management system and has revised its processes for identifying and addressing highway defects, including potholes. The transition to the new system occurred between November 2023 and March 2025. During this period, accurate data is unavailable due to the concurrent use of both systems, resulting in additional duplication.
The previous system and processes considered all enquiries received in relation to potholes as 'reported potholes' and as such contained large numbers of duplicate and inaccurate reports leading to largely overinflated numbers.
We ensure that our highways are inspected by trained inspectors at a frequency determined by our Highways Inspection Manual, who then raise jobs as required such as pothole repairs. In the new process since March 2025, the highway inspectors receive enquiries relating to potholes which they collate, verify via inspection and raise pothole reports for work to be undertaken if necessary. Both the potholes raised via the routine inspections and the verified pothole enquiries make up the 'reported potholes' figures share for April to November 2025.
These new systems and processes enable us to be more efficient and effective in our response, minimises duplication or inaccurate job creation, and provides us with the accurate.
Condition of local roads
Road condition assessments on the local classified road network in England are currently made predominantly using the Surface Condition Assessment for the National Network of Roads (SCANNER) laser-based technology. It produces a road condition indicator which is categorised into 3 condition categories:
- green – no further investigation or treatment required
- amber – maintenance may be required soon
- red – should be considered for maintenance
Derbyshire uses an alternative condition survey method than most of the country. Instead of the SCANNER condition survey, we use a survey called the Annual Engineers Inspection (AEI). This is a treatment survey that records a road’s condition and recommends a treatment to it bring it back to an 'As new' or an 'Up to standard' condition.
This is the same principle as the new DfT methodology for road condition data collection based on British Standards Institute's PAS 2161, which all condition survey contractors must comply with, and all Highway Authorities will report road condition this way.
As Derbyshire no longer uses SCANNER and the DfT did not issue any guidance on alternative survey methods, we had to develop our own interpretation of what constituted Red-Amber-Green in respect of the AEI survey treatments. This has led to a more realistic view of our network and unfortunately this is at odds with most SCANNER based authorities’ road condition statistics.
The following tables show breakdowns Derbyshire's road condition indices using our current categorisation of Red-Amber-Green and a breakdown of our road condition statistics using the new PAS 2161 method:
Percentage of A roads in each condition category
| Year | Red (poor condition) | Amber (fair condition) | Green (good condition) |
|---|
| 2020 |
13% |
23% |
63% |
|---|
| 2021 |
17% |
28% |
55% |
|---|
| 2022 |
20% |
52% |
27% |
|---|
| 2023 |
24% |
58% |
18% |
|---|
| 2024 |
28% |
59% |
28% |
|---|
We survey 100% of our A-road network each year.
Percentage of B and C roads in each condition category
| Year | Red (poor condition) | Amber (fair condition) | Green (good condition) |
|---|
| 2020 |
14% |
34% |
52% |
|---|
| 2021 |
24% |
49% |
27% |
|---|
| 2022 |
24% |
46% |
29% |
|---|
| 2023 |
35% |
54% |
11% |
|---|
| 2024 |
38% |
55% |
7% |
|---|
We survey 100% of our B Roads annually and approximately 20% of the C-Roads annually over a five-year cycle.
Percentage of U roads in Derbyshire in red (poor condition) from 2020 to 2024
| Year | Red (poor condition) |
|---|
| 2020 |
21% |
|---|
| 2021 |
43% |
|---|
| 2022 |
28% |
|---|
| 2023 |
39% |
|---|
| 2024 |
36% |
|---|
Our U-roads are given the same AEI survey as the rest of the A, B and C network and we survey approximately 20% of our U-roads annually over a 5-year cycle. The U roads make up over 50% of Derbyshire’s network and have historically been underfunded compared to more strategic hierarchies. Because of this, most U-roads receive either preventative treatments and/or minor patching with only a modest amount of structural resurfacing treatments.
Revised Condition Reporting
The new PAS 2161 Road Condition Monitoring Standard is a way of measuring a road's condition based on the level of treatment it would need to bring it back up to standard.
The new standard has introduced 2 additional categories: 2 pre-amber and 4 pre-red.
We have revisited the last 5 year’s condition surveys and re-analysed the values of the A, B and C roads and U-roads, based on the new PAS and these are shown following tables:
Condition of A roads in Derbyshire from 2020 to 2024 by PAS2161 risk category
| Year | 5 – red (very poor) | 4 – pre-red | 3 – amber | 2 – pre-amber | 1 – green (good) |
|---|
| 2020 |
5.1% |
1.4% |
12.5% |
7.6% |
73.4% |
|---|
| 2021 |
3.6% |
3.1% |
12.5% |
12.4% |
68.4% |
|---|
| 2022 |
6.7% |
1.8% |
16.5% |
11.6% |
63.4% |
|---|
| 2023 |
5.8% |
1.6% |
20.8% |
9.7% |
62.0% |
|---|
| 2024 |
6.2% |
2.3% |
21.0% |
7.6% |
62.8% |
|---|
Condition of B and C roads in Derbyshire from 2020 to 2024 by PAS2161 risk category
| Year | 5 – red (very poor) | 4 – pre-red | 3 – amber | 2 – pre-amber | 1 – green (good) |
|---|
| 2020 |
2.4% |
3.9% |
13.7% |
16.7% |
63.3% |
|---|
| 2021 |
1.5% |
4.0% |
18.2% |
21.3% |
55.0% |
|---|
| 2022 |
2.7% |
3.9% |
23.4% |
17.4% |
52.6% |
|---|
| 2023 |
2.9% |
4.1% |
30.8% |
11.4% |
50.8% |
|---|
| 2024 |
3.2% |
3.8% |
38.5% |
9.2% |
45.3% |
|---|
Percentage of U roads in Derbyshire in red (very poor) condition from 2020 to 2024
| Year | 5 – red (very poor) |
|---|
| 2020 |
6.20% |
|---|
| 2021 |
6.60% |
|---|
| 2022 |
9.60% |
|---|
| 2023 |
11.80% |
|---|
| 2024 |
12.80% |
|---|
It is noted that although the actual values have changed due to the new interpretation, it demonstrates that both indices are showing an overall deterioration of our highway network’s condition. The new PAS has clarified and standardised road condition categories on a more granular level, allowing targeted investment and like for like comparison with all other Highways Authorities .
We have trialled the use of innovative data collection for carriageway condition and defect identification using AI.
We also carry out a skidding resistance survey called the Sideways Force Co-efficient Routine Inspection machine (SCRIM) survey. This is carried out annually on all A and B roads and remaining roads within road hierarchies 1 to 4. This allows us to address problems with skidding resistance in compliance with the council’s Skid Policy making Derbyshire’s roads safer.
Although carriageways are the most prominent asset group, the condition of the other highway assets such as bridges and retaining walls also gives cause for concern, recent severe weather events have caused existing landslips to move more and also created new slips. Bridges are experiencing scour due to higher river flow levels and retaining walls are being destabilised due to ground water undermining their construction, reducing the ability to support the road.
Plans
Overall strategy
Derbyshire carries out an asset management approach to the maintenance of its highway infrastructure, including adoption of the recommendations set out in the guidance 'Well Managed Highway Infrastructure: A Code of Practice' published in October 2016 by UK Roads Leadership Group (UKRLG).
We look to maximise the lifespan of each asset by prioritising long term, planned maintenance to keep our road network safe and to support the economic, social and environmental well-being of the county.
To do this, we look at the age and condition of each asset and identify the most effective repair required. For example, it may mean a road is patched rather than resurfaced, but in the order of importance it is still fit for purpose for its level of use.
We have a suite of documents relating to our highways infrastructure asset management policies, including the Highways Network Management Plan, Traffic Network Duty Plan, Highways Infrastructure Assets Safety Inspection Manual, Local Flood Risk Management Strategy, and Resilient Network Plan.
By using asset management principles, we are following best practice and this allows us to be more aware of the needs of our network. We collaborate and share best practice with other authorities and industry groups including the East Midlands Combined County Authority (EMCCA), Future Highways Research Group (FHRG), Local Council Roads Innovation Group (LCRIG), Midlands Highway Alliance (MHA+), United Kingdom Roads Leadership Group (UKRLG), Department for Transport (DfT) and others.
This enables us to be more aware of, and to use, new innovative solutions towards maintenance in our drive to reduce carbon and increase durability and resilience. In addition, we also undertake independent peer reviewed Value for Money (VfM) assessments to assess our highways service taking into account a defined set of factors : Economy, Efficiency, Effectiveness, Strategic Value, Stakeholder Value. The last peer review was undertaken in October 2024 and the outcome was a trajectory of ‘good’ which is a direct result of the on-going work as part of the Derbyshire Highways Transformation Programme.
We also liaise with our supply chain and use national framework contracts and our own bespoke contracts to deliver a massive programme of road works, utilising innovative and conventional treatments.
Specific plans for 2025/26
The condition of Derbyshire's roads is our residents' biggest concern. In recognition of this we have increased the amount of funding to target improvements on this asset with increased number of gangs carrying out pothole and minor patching works. With the increased investment received and a focus on prevention we hope to see a reduction in pothole numbers.
Recognising the importance of preventative treatments to prevent potholes, we have also increased the size of our asphalt rejuvenation, surface dressing and micro-asphalt programmes.
In 2025/26 we plan to:
- resurface 10.9km and give a preventative treatment to 87.1km of carriageways
- resurface 10.2km and give a preventative treatment to 16.4km of footways
We will also continue our bridges and landslip programme to improve the condition of storm damaged structures and landslips. Implement flood alleviation schemes to enhance our highway drainage systems, install new footways and pedestrian crossings and improve bus-stop infrastructure and accessibility.
Our wider Capital programme promotes active travel, with the development and improvement of cycle networks to encourage alternative modes of transport, reducing carbon and improving health. We are also promoting air quality management action plans to implement traffic management and sustainable travel options to tackle transport related poor air quality.
Streetworks
Derbyshire follows the legislation relating to street works, namely the New Roads and Street Works Act (NRSWA) 1991, Traffic Management Act 2004, Road Traffic Regulation Act 1984, the Highways and Utilities Commissions (HAUC) Guidance Procedures 2025, and the Department for Transport’s (DfT) Code of Practice for Street Works Inspections 2023, all of which outline the duties and responsibilities of the county council as Highway Authority and also utility companies as works promoters.
Derbyshire co-ordinates street works to prevent congestion and minimise disruption, holding regular co-ordination meetings with all statutory undertakers and adjacent Highways Authorities and more detailed programme specific liaison meetings where extensive programmes of works are being proposed, to ensure that the county’s road network is managed efficiently and effectively.
Derbyshire uses a permit system to vet any proposals and enable effective management of works on the Highway. We have a dedicated Network Intelligence centre to identify issues and utilises CCTV images to enable quick decisions to be made to improve any traffic congestion relating to roadworks.
Climate change, resilience and adaptation
Derbyshire is taking a proactive approach and has implemented a surfacing materials policy which provides for prolonged durability to ensure resilience against extreme weather events. This will reduce the amount of carbon in the lifecycle of a road and with the use of various preventative treatments this will mean fewer major interventions are needed.
Derbyshire has adopted warm mix asphalts in its materials policy to reduce the amount of carbon produced in the manufacturing process, the reduction in mixing temperature also preserves the bitumen, building in durability as an added benefit. Complimenting this approach we also use materials containing recycled construction waste and will be expanding the use of carriageway recycling.
We have a large preventative maintenance treatment programme to seal carriageway and footway surfaces to prevent deterioration and build in more resilience to the network, preventing the formation of potholes and the need for more expensive and carbon intensive works that increase disruption to road users.
Derbyshire is one of the few councils that has its own Highway Materials Laboratory, this ensures quality is achieved by sampling and testing materials used and checking build compliance to confirm that both are up to standard to ensure durability and reduce carbon emissions.
The laboratory also conducts trials of new and innovative materials and is currently undertaking a long-term project on various pothole repair products to assess the quality and suitability for pothole repairs in Derbyshire, as well as working closely with the FHRG and Proving Services to develop our carbon baseline assessment that in turn will help inform our approach to decarbonisation.